

2024 Voting Demographics
The trend towards a more diverse and educated electorate continues even as the electorate was older

My analysis of the Census Bureau’s Current Population Survey Voting and Registration Supplement indicates the trend towards a more diverse and educated electorate continues, even as the electorate was older.
What is the Current Population Survey?
Before I dive into my analysis let me explain what the Current Population Survey (aka CPS) is and how I analyze it. Feel free to scroll past.
The Current Population Survey is the Census Bureau’s monthly household survey used primarily to calculate the unemployment rate. Due to its importance the Census Bureau invests substantial resources into conducting the survey. In the November of a federal election year the Census Bureau asks a few additional questions about voting and registration.
Among CPS’s strengths are that there are 126,686 persons in the November 2024 sample, the survey includes very detailed demographic questions, the Census Bureau makes multiple contact attempts to reduce non-response bias, and the surveyors even conduct some in-person interviews.
Among the CPS’s weaknesses is that as a government survey Census Bureau asks only limited questions about voting and registration. The Census Bureau does not ask about who people voted for, nor do they ask many behavioral and attitudinal questions that may illuminate why people vote, such as their partisanship and attention to politics.
Another weakness involves what is known as “over-report bias” or the tendency in all post-election surveys of a greater share of people reporting that they voted than turnout data — such as my turnout rate calculations — indicate. The Census Bureau attempts to deflate over-report bias in a very non-standard way. They code the 1.5% of respondents who refused to answer the voting question and the 1.7% who said they did not know as “did not vote.” Survey researchers would normally treat these responses as missing data and exclude them from calculations.
A more problematic practice involves who is asked the voting questions. These questions come at the end of a very lengthy survey and interviewers are trained to prioritize answers for the understandably important questions needed to calculate the unemployment rate. The November voting and registration supplement questions are asked following these other questions, and 10.9% of interviewers ended the interview before asking the voting questions. The Census Bureau also codes these respondents who were never asked the voting question as “did not vote.” These people are missing data and should be excluded from turnout rate calculations.
Now, the Census Bureau is aware that they are fudging the numbers. I’ve given a talk to the Census Bureau about this issue and conversed with them on what might be done to address this problem. The November Voting and Registration Supplement is the only monthly supplement that is not paid for by another government department, so it could easily disappear. I’m grateful to the Census Bureau for asking these questions because they provide insights to the demographic composition of the electorate to a degree beyond any other survey.
The question remains what to do about the missing data. If the missing data are all counted as did not vote, then the national citizen-voting-age (CVAP) population turnout rate is 65.3%., which is near my estimate of the voting-eligible population (VEP) turnout rate of 64.1%. (I won’t go into the details, but there are minor and subtle differences between the CPS CVAP and my VEP turnout rates.) If the missing data are excluded, however, the CPS turnout rate is an implausibly high 76.1%.
Two researchers, Aram Hur and Christopher Achen, propose excluding the missing data and reweighting the CPS such that the CPS’s state turnout rates equal my state turnout rates. More likely this is a better solution, but it would go awry if the CPS respondents with missing voting responses differ in large and substantial ways than those who do respond. I wanted to work with the Census Bureau to explore a more accurate approach, but unfortunately red tape got in the way. My following analyses use the Hur and Achen approach, which is most likely better than following the Census Bureau’s practice of counting missing data as did not vote.
Voting Demographic Trends
Either you skipped here or you read through that long section to learn something about the many things I regularly think about to provide you with as good of information as I can. If you want the data I discuss, I post CPS demographic data and visualizations on the UF Election Lab website.
Overall, the turnout rate dipped slightly from 2020’s 66.4% among those eligible to vote to 64.1% in 2024. The 2020 turnout rate was the highest since 1900, so it is not entirely surprising that there was a slight retrenchment.
When turnout rates decline, the declines are usually centered more among lower-propensity voting groups, such as the youth, diverse communities, and persons with lower education. That was the case in 2024. Some turnout rate statistics supporting this trend:
The CVAP turnout rate for non-Hispanic Whites dropped 1.6 points while the turnout rates for non-Hispanic Blacks decreased 5.8 points, Hispanics dropped 5.3 points, and all other racial groups dropped 3.7 points.
The turnout rate for citizens age 60 or older decreased by 2.4 points while turnout rates for citizens age 18 to 29 dropped 4.0 points, age 30 to 44 dropped 4.5 points, and age 45 to 59 dropped 2.7 points.
The CVAP turnout rate for persons with advanced degree education decreased 0.7 points while turnout rates for persons with some college or a college degree dropped 2.9 points, persons with a high school diploma dropped 4.0 points, and persons without a high school diploma dropped 4.0 points.
One might reasonably assume from these turnout rates that the electorate became less diverse, older, and more educated. However, there are some important demographic trends that continue to grind away in the county, making it overall more diverse, younger, and better educated.
Thus, the electorate surprisingly became slightly more diverse, with the non-Hispanic White share of the electorate slightly 0.3 points falling from 71.2% of the electorate in 2020 to 70.9% in 2024.
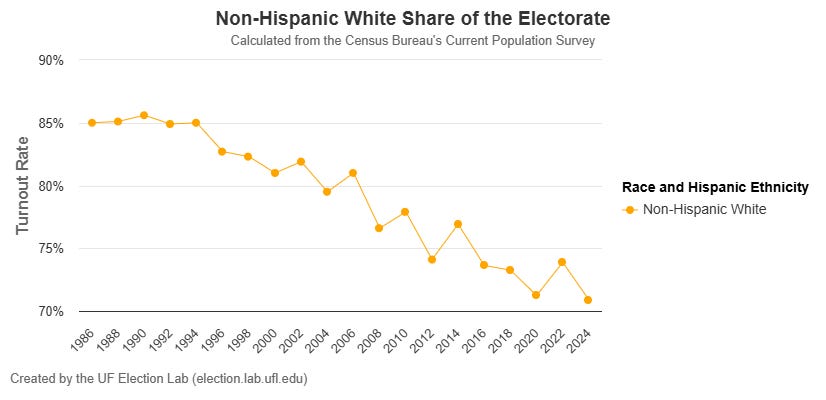
The long-term trend of growing diversity in the electorate that started in the early 1900s appears to have slowed in recent years. The Census Bureau continues to report that the country as a whole is becoming more diverse, and that this is bubbling up from among younger people who are much more diverse.
The slowing trend in the presidential electorate’s growing diversity that occurred across 2020 and 2024 appears to be located in lower voter turnout, among non-Hispanic Blacks and Hispanics in particular. Indeed, the decreasing diversity from 2018 (a midterm election where voters in opposition to Donald Trump were activated) to 2022 (where voters opposing Joe Biden were activated), can perhaps likewise be understood in light of knowing non-Hispanic White turnout decreased only 2.4 points while non-Hispanic Blacks decreased 10.7 points and Hispanics decreased 6.3 points. Diversity and age are intertwined, so it is of interest that as the electorate became slightly more diverse, it also became slightly older, with citizens age 60 or older increasing their share of the electorate by 2.0 points. This may seem a bit of a puzzle of how the electorate could become more diverse and older at the same time, but it is again best understood in that younger generations are becoming more diverse.
Trump once said that he “loves the poorly educated.” These groups continue to decline as a share of the electorate, which is according to the Census Bureau part of a long-term trend towards a more educated society. The share of the electorate without a high school education declined 0.7 points and those with a high school diploma only decreased 1.1 points.
Another important takeaway from these turnout rates is that one should be cautious in inferring changes in voting preferences among demographic groups, such as Hispanics. If the people who stayed home in 2024 are politically different than those who voted, then perceived changes among voters may be magnified. Indeed, my analyses among Florida and North Carolina registered voters shows that registered Democrats abstained at higher rates than Republicans. Some of Trump’s 2024 victory is due to changes preferences and some is due to changing turnout.
If history is a guide, Democratic leaning groups will be activated again in the 2026 midterm elections, much as they were in 2018. Political conditions can always change, but at the moment I expect that the 2022 and 2024 electorates will not repeat in Republicans’ favor come 2026.